

USD/INR recovers as Rupee slips on Oil bounce, equity weakness
The Indian Rupee (INR) trades on the back foot against the US Dollar (USD) on Monday, weighed down by month-end Greenback demand, capital outflows, and a mild rebound in Crude Oil prices. This pullback comes after the Rupee notched its strongest weekly performance since January 2023.
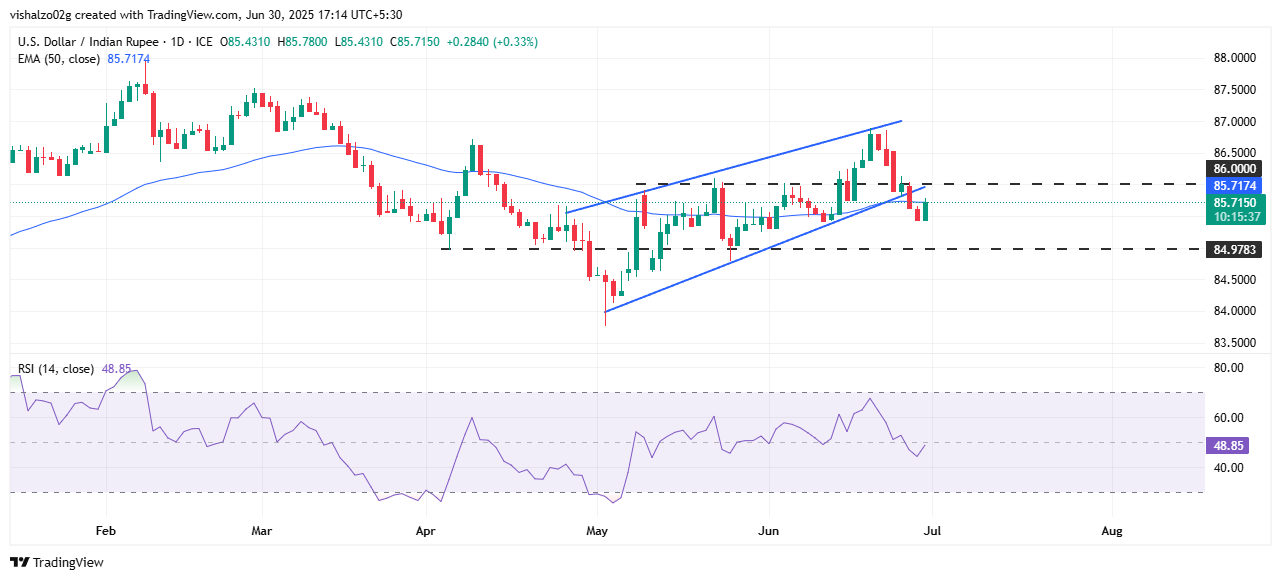
The USD/INR pair is edging higher, erasing all of Friday’s losses and trading around 85.70 at the time of writing. However, the pair is hovering just below the 50-day Exponential Moving Average (EMA), highlighting a key technical hurdle for bulls.
Meanwhile, theUS Dollar Index(DXY) opens the week on a flat footing, continuing to hover near multi-year lows around 97.00.
Despite the broader weakness in the US Dollar, the Rupee is struggling to capitalize as domestic and technical drivers are steering the USD/INR. The Greenback has ended the past five months in the red and is on track to close this month lower as well.
Expectations for an Interest-rate cut have intensified over the past few days, with traders now assigning a growing probability to policy easing as early as September. Market pricing suggests the likelihood of a rate cut in July has inched to 21.2%, while the odds for a September move have climbed to 73.8%, according to CME Group’s FedWatch Tool. This shift reflects investor reaction to mounting fiscal concerns, political pressure on theFed, and a softening USeconomic outlook— all of which are fueling bets that the Fed could begin loosening policy sooner than previously anticipated.
Market movers: Rupee slides, equities fall, Oil rebounds, Industrial Output slows
Technical analysis: USD/INR tests 50-day EMA after bouncing from 85.50 support
USD/INR is trading around 85.71 on Monday, testing the 50-day EMA near 85.72, after bouncing off a key support level at 85.50. The pair briefly dipped below this zone but failed to sustain the move, triggering a mild intraday reversal.
The recovery comes after a breakdown below the rising wedge pattern, signaling potential bearish fatigue. Immediate support remains at 84.98, while 86.00 stands as the next resistance. The daily Relative Strength Index (RSI), hovering near 48.85, points to neutral momentum.
A decisive close above the 50-day EMA could stabilize the outlook, while failure to hold above 85.50–85.70 may invite renewed selling pressure. Traders will likely remain cautious ahead of high-impact US data this week.
Economic Indicator
Industrial Output
Industrial output, an indicator measured by theRelease and Implementation Program Statistics Departmentmeasure the output of Indian factories. Changes in industrial output are commonly observed as an indicator of strength in the manufacturing sector. A high index is considered positive (or uptrend) for Rupee, while a low index is considered negative (or downtrend) for Rupee.
Last release:Mon Jun 30, 2025 10:30
Frequency:Monthly
Actual:1.2%
Consensus:2.4%
Previous:2.7%
Source:


_300xx250.jpg)
0 댓글